
Python-Pandas自动化办公
该文章持续更新中…
环境声明
环境声明
- 系统: Windows10家庭中文版
- 硬件: 16G内存、8核CPU
- Py版本: 3.7.6
- Pandas版本: 1.3.5
- Matplotlib版本: 3.3.4
- 强烈推荐学习视频: Python自动化办公社区
- 视频配套资料: 语雀-Python自动化办公
环境部署
安装Pandas
1 | # 使用清华源加速下载 |
安装openpyxl
1 | # 使用清华源加速下载 |
安装matplotlib
1 | # 使用清华源加速下载 |
基本操作
创建文件
语法
- 写入数据时记得把目标文件关闭
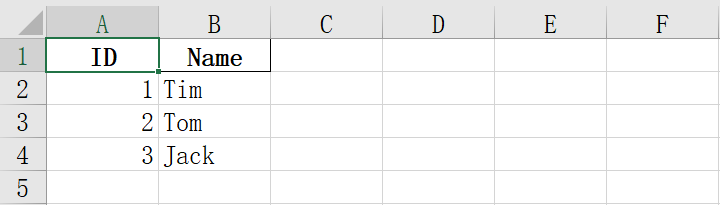
to_excel()方法指定index=Flase时不写入索引到表格
1 | import pandas as pd |
不写入索引
- 执行成功后打开
out.xlsx文件就可以看到写入的内容 - 指定索引为某列时,导出后表格中不会出现索引
- 如果不指定索引为某列且不想导出索引时,可以设置
to_excel()方法的index参数为False
1 | import pandas as pd |
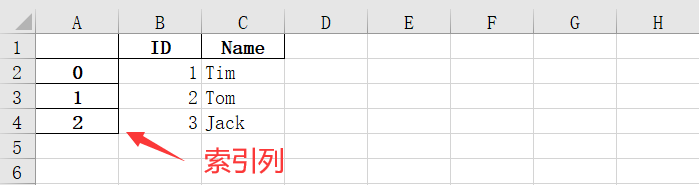
写入索引
- 未指定索引字段时,会自动创建一列作为索引
- 或者未设置
to_excel()方法的index参数为False
1 | import pandas as pd |
读取文件
语法
read_excel()方法中指定表头行数,默认表头为第0行 (索引从0开始)- 当第0行存在脏数据时,可以指定
header参数为其他行,将其他行作为表头 - 当表格没有表头时,可以指定
header参数为None,表示不指定表头,且可使用columns指定表头内容
1 | import pandas as pd |
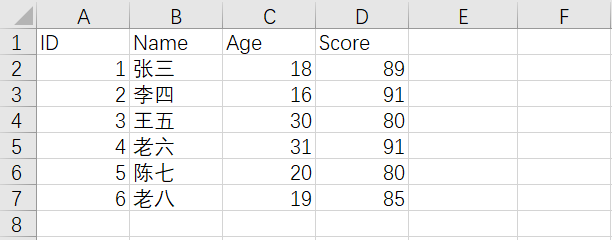
常规读取
1 | import pandas as pd |
1 | # 结果 |
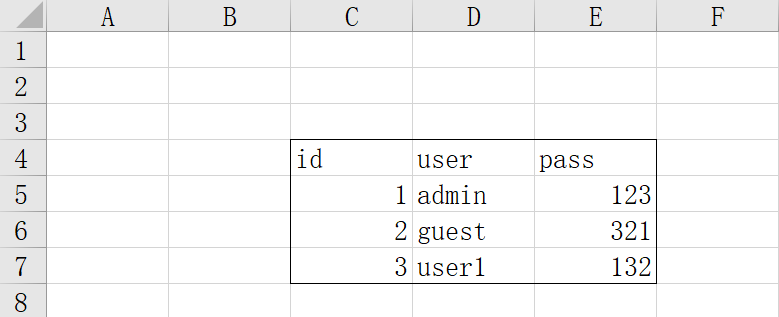
跳过空行空列
- 当需要的数据不在左上角时,可以指定
skiprows参数跳过N行,执行usecols参数读取指定范围的列
1 | import pandas as pd |
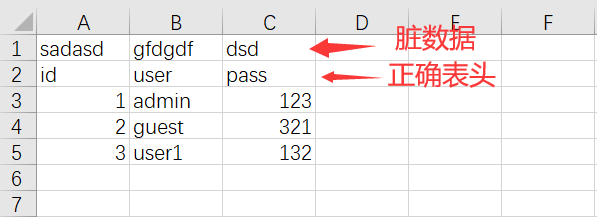
跳过脏数据
- 默认第一行为表头,当第一行不为表头时可以设置其他行为表头
1 | import pandas as pd |
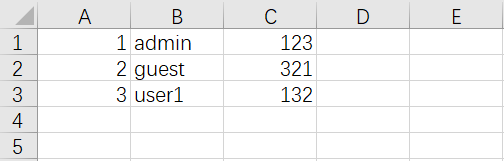
不指定表头
- 不指定表头时默认表头为数字
1 | import pandas as pd |
1 | # 自定义表头 |
数据序列
语法
- 多行数据索引不一致时,值自动设置为
NaN
1 | import pandas as pd |
创建序列
1 | import pandas as pd |
示例2
index就相当于行号,name就相当于列名- 先创建序列,再把序列放到
DataFrame中
1 | import pandas as pd |
示例3
- 当索引与其他序列不一样时,单元格内容为
NaN
1 | import pandas as pd |
修改数据
语法
1 | import pandas as pd |
方法1
1 | import pandas as pd |
方法2
1 | import pandas as pd |
自动填充
填充数字
- 可以利用for循环来自动填充数据
- ID的默认数据类型为float,需要修改为int类型
- 但单元格中存在空值,所以不能转化为Int类型,可以先转换为字符型
1 | import pandas as pd |
填充日期
- 原理同上, 在月份运算上还有一个bug可以优化
1 | import pandas as pd |
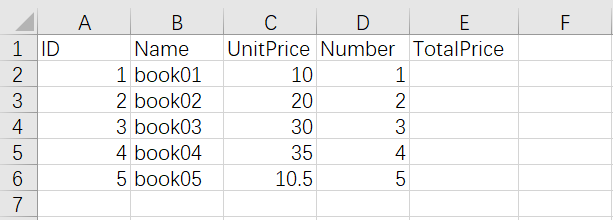
函数填充
- 要运算
TotalPrice时,可以获取UnitPrice与Number列的数据,将两列数据相乘并赋值给TotalPrice就可以了 - 当单元格的值为空时,得到的结果也为空
1 | import pandas as pd |
填充部分单元格
- 如果只需要运算部分单元格时,可以使用for循环进行迭代
1 | import pandas as pd |
数据排序
语法
sort_values()方法的inplace参数为True时表示不创建新的DataFrame,而是在当前的DataFrame上操作sort_values()方法的ascending参数为True时表示升序, 为False时表示降序,默认为True- 多重排序时可以对多个列进行升序或降序来排序,
by中的列名对应ascending中的排序方式
1 | import pandas as pd |
单列排序
- 按照
UnitPrice进行升序排序
1 | import pandas as pd |
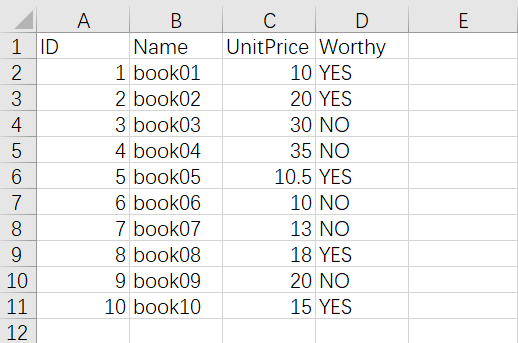
多重排序
- 找出
Worthy为NO中UnitPrice最高的行数据 - 先对
Worthy列按照升序排序,再对UnitPrice列进行降序排序即可
1 | import pandas as pd |
筛选过滤
语法
- 按照
DataFrame中的某列进行筛选 - 定义一个函数用于筛选传递进来的数据,再使用
apply()方法调用该函数 - 注意
apply()方法中传递的是函数名,也可以使用lambda匿名函数
1 | import pandas as pd |
一级筛选
- 筛选出年龄在18~29之间的学生
1 | import pandas as pd |
多级筛选
- 筛选出年龄在18~29之间的学生
- 筛选出成绩在85~100分之间的学生
- 使用
lambda匿名函数比较方便
1 | import pandas as pd |
数据可视化
柱图
语法
- 绘制图表前需要先安装
matplotlib库 plot.bar()方法为垂直柱图,plot.barh()方法为水平柱图
1 | import pandas as pd |
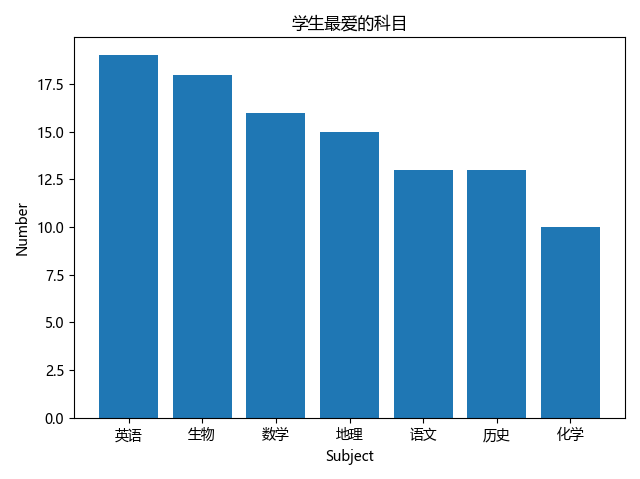
Pandas绘图
- 如果需要对图表进行排序可以先对数据进行排序再生成图标
- 排序时要指定
inplace为True,不然会生成新DataFrame
1 | import pandas as pd |
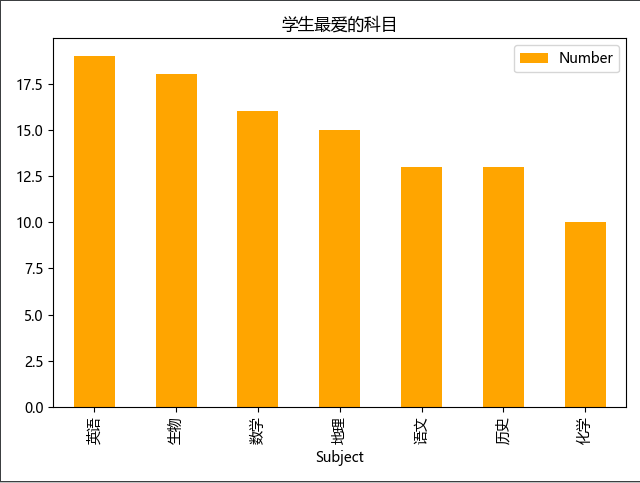
matplotlib绘图
- 使用
matplotlib来进行绘图要相对灵活,Pandas只能绘制一些中规中矩的图
1 | import pandas as pd |
优化柱图
语法
- 可以借助
matplotlib来优化图表
1 | from matplotlib import pylab as plt |
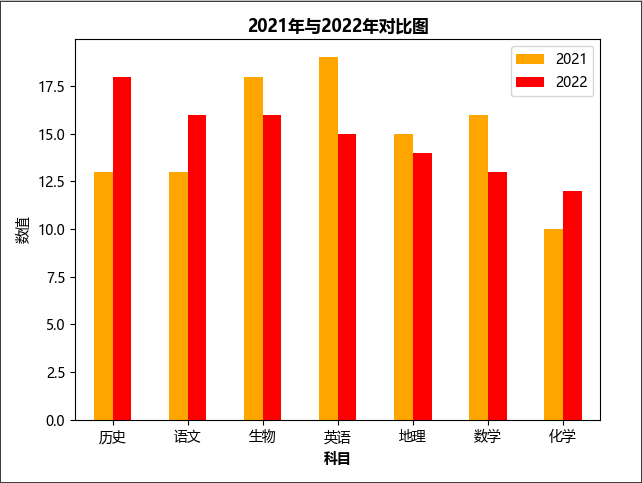
多列数据柱图
- 当列名为数字时,对该列数据进行排序或绘图时不要给数字的列名加引号!!!
- 也可以使用
Pandas生成多列数据图,参考上方
1 | import pandas as pd |
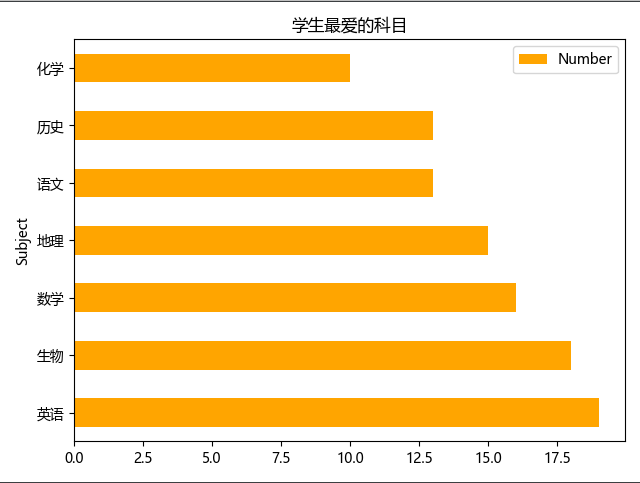
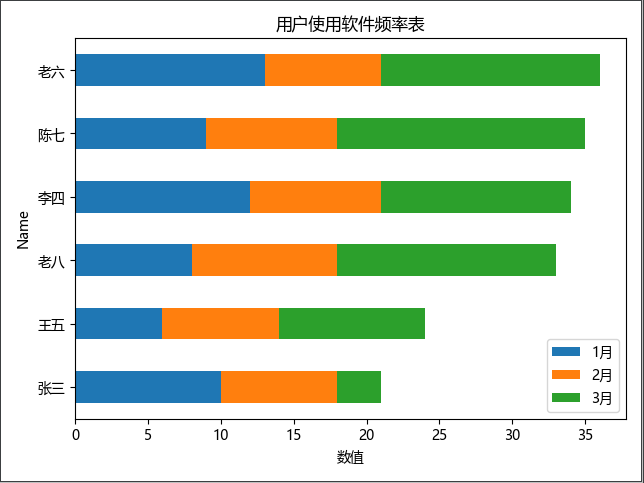
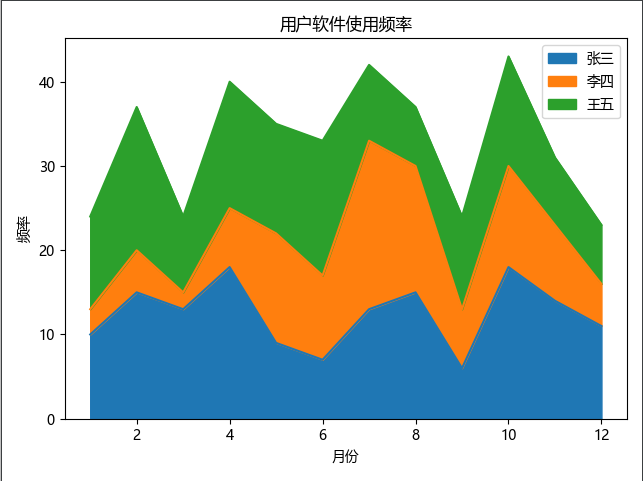
叠加水平柱状图
- 将
plot.barh()或plot.bar()方法的stacked属性设置为True就为叠加柱图
1 | import pandas as pd |
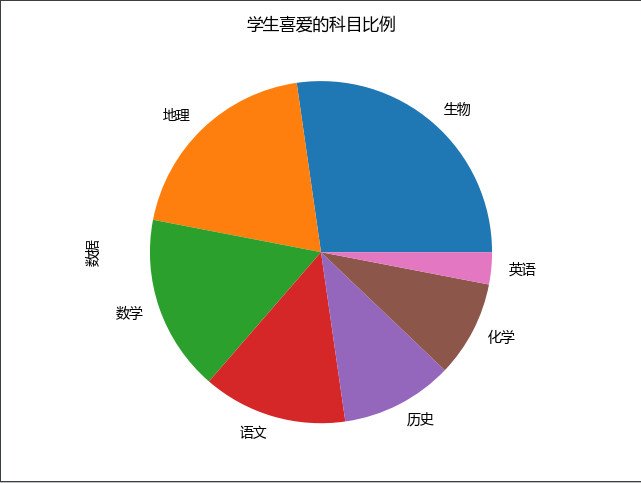
饼图
语法
- 绘制饼图时把xx值设置为索引列,再指定某列为数据列
1 | import pandas as pd |
示例
1 | import pandas as pd |
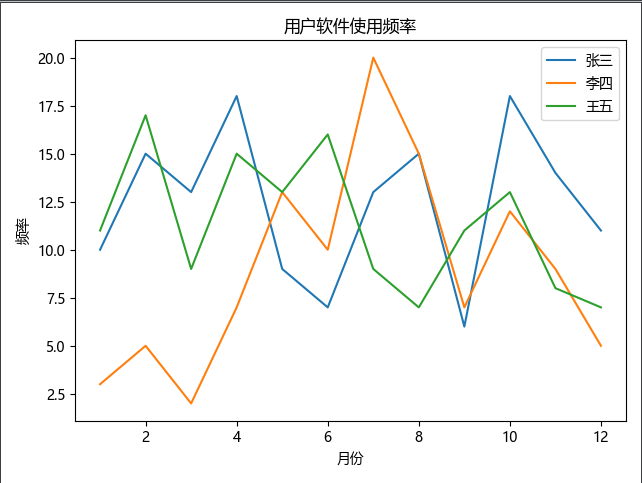
折线图
语法
- 读取文件时指定索引列为x轴
1 | import pandas as pd |
折线图示例
1 | import pandas as pd |
散点图
语法
1 | import pandas as pd |
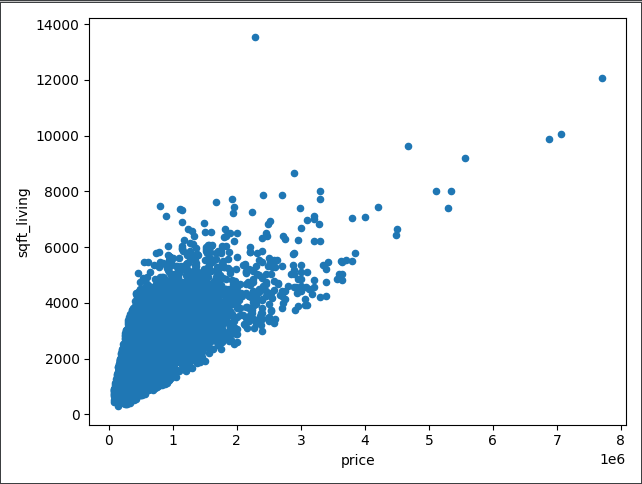
绘制散点图
- —>下载实验数据<—
1 | import pandas as pd |
直方图
语法
1 | import pandas as pd |
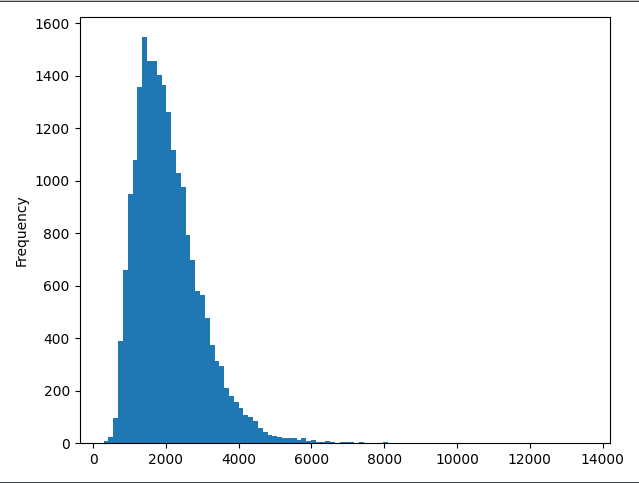
绘制直方图
- 实验数据同上
1 | import pandas as pd |
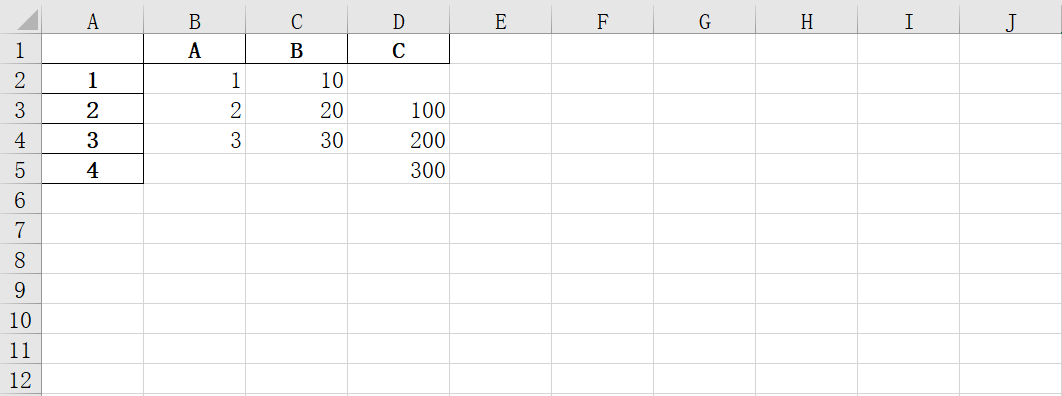
多表联合
语法
- 这里的多表指的是一个xlsx文件里有多个表,而不是多个xlsx文件
- 内连接取多表的共同信息字段
- 左连接取左表的所有信息,右表与左表的共同信息
- 右连接取右表的所有信息,左表与右表的共同信息
1 | import pandas as pd |
实验数据
1 | # Students表 |
内连接
- 只取
Students表与Scores表ID列共同值的数据
1 | import pandas as pd |
左连接
- 取
Students表的所有数据,与Scores表与Students表ID列共同值的数据
1 | import pandas as pd |
右连接
- 取
Scores表的所有数据, 与Scores表与Students表ID列共同值的数据
1 | import pandas as pd |
数据校验
语法
- 先定义一个函数用来校验数据,再使用
apply()方法调用该函数进行校验 apply()方法的asix轴参数为0时表示从上到下(一列一列)校验,参数为1时表示从左到右(一行一行)校验
1 | import pandas as pd |
抓出错误数据
- 成绩列正确范围在
0~100之间,如果成绩列存在错误数据就抓出来
1 | import pandas as pd |
数据分割
语法
- 分隔符不指定时默认为
空格或换行符,可以指定安州某些符号来进行分割 - 参数
expand为True时表示分割成多列,默认为False
1 | import pandas as pd |
分割示例
1 | import pandas as pd |
统计函数
语法
- 先创建一个临时的DataFrame,将需要运算的数据以列表的方式指定
- 再调用
DataFrame的sum()或mean()方法一列一列或一行一行的求总分或平均分 - 再将得到的结果写回原来的
DataFrame中
1 | import pandas as pd |
统计示例
- 求每个人的三次测试中的总分与平均分
- 求每次测试的平均分
1 | import pandas as pd |
数据清洗
语法
- 如果需要剔除多个列的重复数据可以修改
drop_duplicates()方法中的subset参数为列表 drop_duplicates()方法的keep参数为first时表示保留最先出现的数据(默认),为last时表示保留最后出现的数据duplicated()方法返回某行为False时表示该行数据不重复,返回True表示该行数据为重复数据
1 | import pandas as pd |
清除重复数据
1 | import pandas as pd |
取出重复数据
1 | import pandas as pd |
空数据处理
1 | import pandas as pd |
读取数据
语法
csv或txt文件可以使用excel另存为时选择
1 | import pandas as pd |
读取csv文件
- 可以创建一个txt文件,把下面的数据复制保存后,将后缀改成.csv
1 | import pandas as pd |
读取txt文件
- 可以创建一个txt文件,把下面的数据复制保存
1 | import pandas as pd |
数据着色
语法
1 | import pandas as pd |
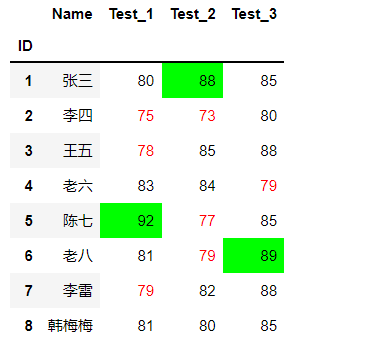
示例
- 注意在pycharm中并不会标记出颜色,可以使用Jupyter来写代码
- 将分数小于80分的文本标注成红色,每次分数最高的单元格标注成绿色
1 | import pandas as pd |
本博客所有文章除特别声明外,均采用 CC BY-NC-SA 4.0 许可协议。转载请注明来自 大胖胖的笔记!
 wechat
 alipay